Using Transparency in Coverage Reimbursement Insights to Inform Payer and Provider Contracting Strategy
Executive Summary
“Transparency in Coverage” (TIC) data is a newer data source that has recently become available for mining unique insights in the reimbursement/economics between payers and providers. In 2020, the Federal Government TIC Rule required health insurers and group health plans, including self-funded clients, to provide cost-sharing data to consumers via machine-readable files and a consumer price transparency tool. Beginning July 1, 2022, machine-readable files were published publicly, and include pricing data for covered items and services based on in-network negotiated payment rates and historical out-of-network allowed amounts.
Trinity Life Sciences has been mining these files for a couple of years to assess medical benefit “buy and bill” considerations for payers and providers. This enables us to provide unique insights to clients in terms of:

- Payer reimbursement for top providers for both client products and competitors
- Provider net cost recovery for client and competitors
- Reimbursement trends and bases (e.g. average wholesale price (AWP) vs. average sales price (ASP))
The value of this published reimbursement data is that it is more comprehensive than the other sources of reimbursement data such as claims “remittances” which include the adjudicated prices for a small subset of medical claims data. Because the Federal government requires payers to publish the data, virtually all combinations of payer and provider reimbursement data are available. Transparency data does not suffer from the reduced capture rates, or provider or payer “blocking” of data. Despite the challenges of using the data (e.g. files can be a terabyte in size and information is distributed across thousands of files), Trinity has been processing the data and using Artificial Intelligence techniques to manage through the complications and assess the most accurate payer-provider reimbursement combinations.
An Introduction to “Buy and Bill” Economics and the Importance of Understanding Payer Reimbursement
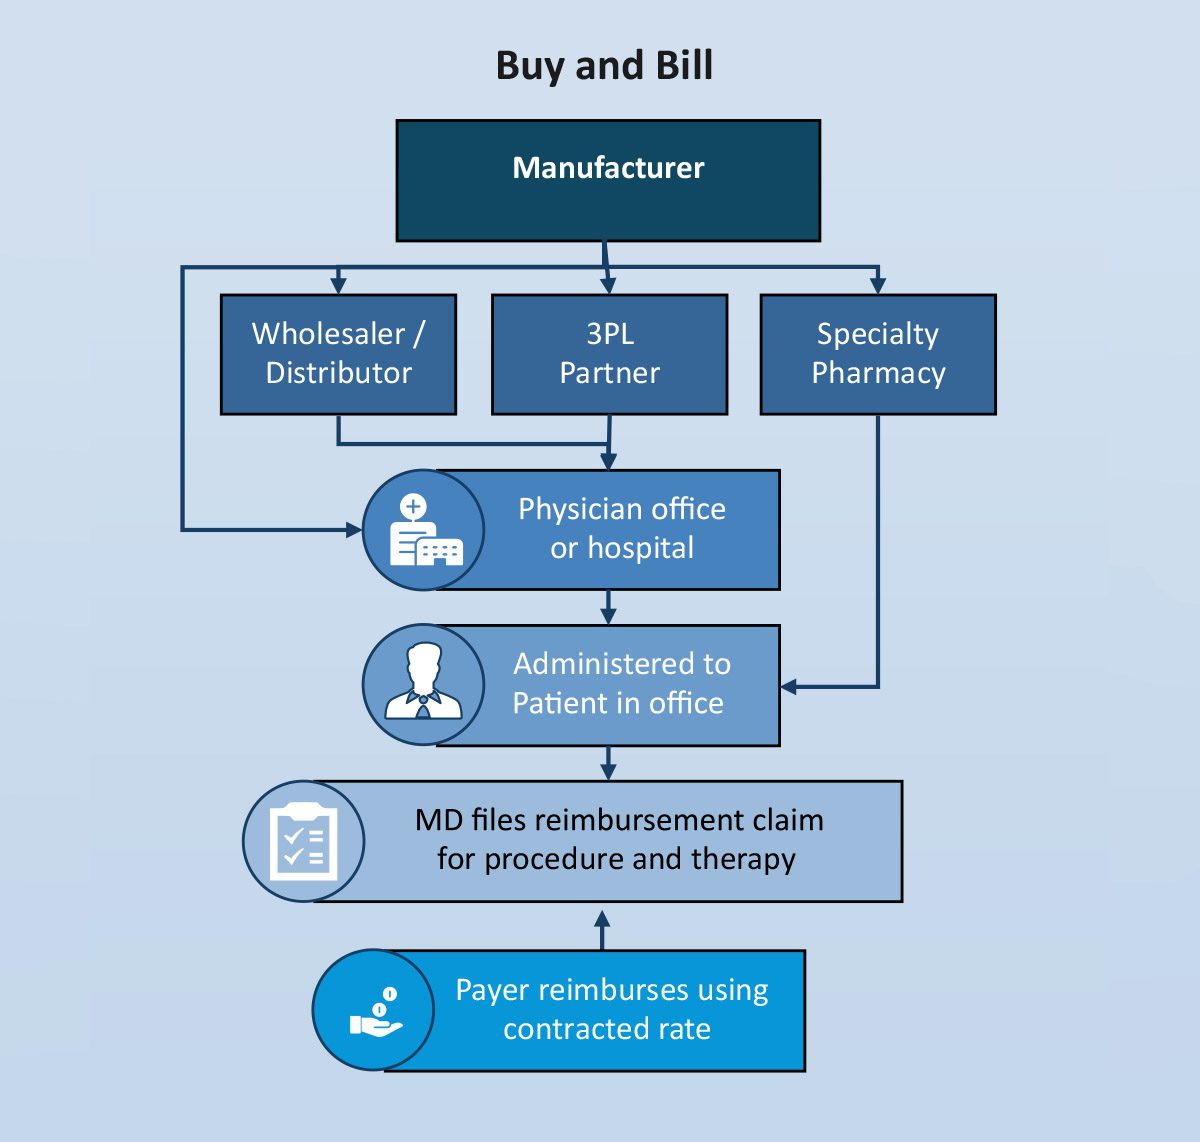
Many products administered in a physician’s office, hospital outpatient setting and in the home have historically been covered under the medical benefit (adjudicated by a health plan, not a pharmacy benefit manager (PBM)) because of the need for a healthcare professional to administer the product. In this scenario, the physician practice or other site of care purchases (takes title) the product, administers it and then bills the insurance company for the product as well as any covered services involved in the actual administration. The difference between the reimbursed price and the acquisition price is considered net cost recovery (NCR) from the perspective of the practice.
Payer reimbursement for the product comes down to a contract negotiation between the payer and the provider. Typically the reimbursed price is a function of the Medicare published ASP and the percent markup allowed by the payer or AWP and the markup or discount allowed by the payer.
Understanding the actual payer reimbursement price levels is critical for manufacturers negotiating with both payers and providers. The reimbursement price is the actual cost to the payer for that product being administered by a specific provider. Understanding the actual costs improves a manufacturer’s negotiating position for payer access and increases economic transparency with providers claiming to be “underwater” on NCR.
A high-level illustration of the “buy and bill” process is outlined below:

Trinity has conducted analysis of reimbursement data for several therapeutic areas and has surfaced some powerful insights in some therapeutic areas that can aid in manufacturer contracting strategy. We are sharing some of these observations (blinded but directionally correct) to illustrate the potential value of this reimbursement detail. This granular detail on reimbursement rates has not been available to manufacturers prior to Trinity’s unlocking the secrets of transparency in coverage. These example observations can lead to insights that will increase manufacturer understanding of the costs and strategies payer and provider negotiations leverage.
Insight 1: Payer Use of Reimbursement to Influence Site of Care Selection
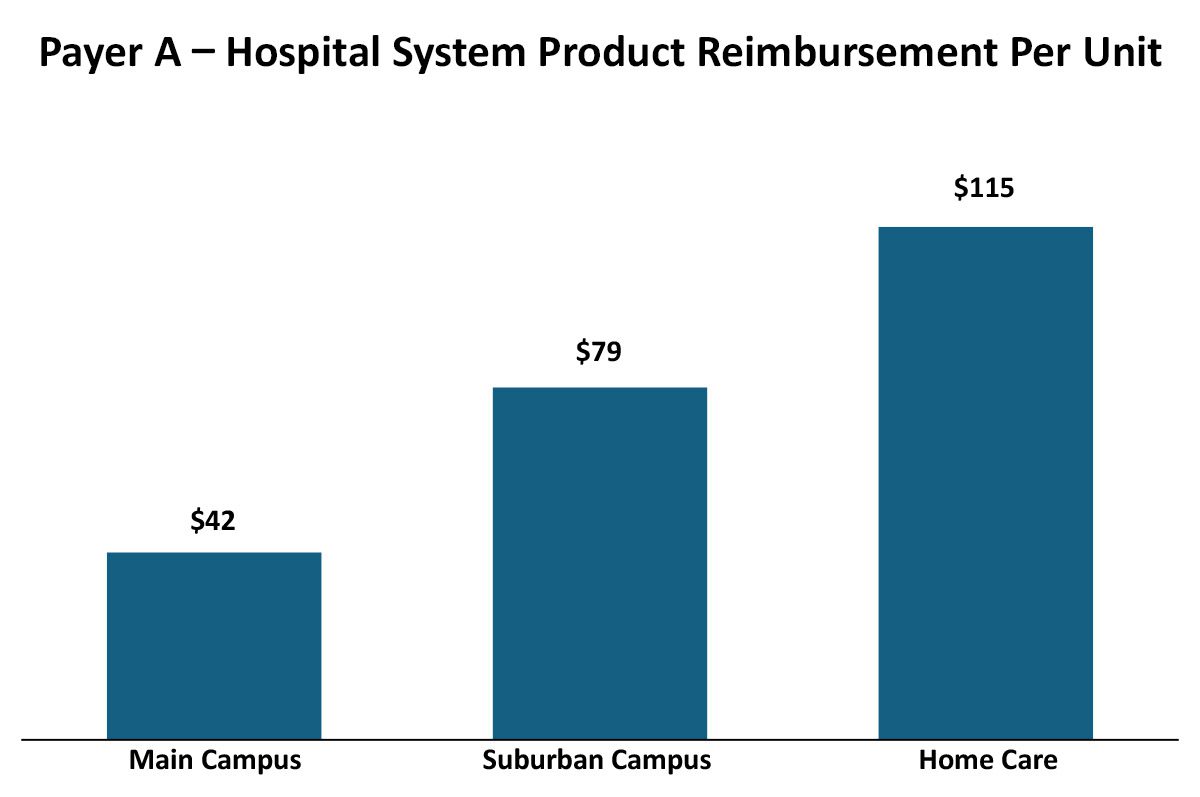
While historically, payers had relatively straightforward and consistent approaches to provider reimbursement (e.g. ASP +10% or AWP -20%), more recently payers have been evolving their reimbursement methodologies to drive their own (and that of their parent company’s) economic performance. These variations can be across therapeutic areas, sites of care and even products within a therapeutic area. For example, payers may vary their reimbursement by different sites within an Integrated Delivery Network. In this real but blinded example, a payer had different reimbursement rates for the same product in the same Integrated Delivery Network that varied by site of care (as identified by the NPI):

Implications For Manufacturers
There may be a number of reasons why the reimbursement varies across sites of care within this Integrated Delivery Network, which in turn helps manufacturers gain leverage in developing contracting and marketing strategies.
Differences between outpatient sites of care reimbursement rates
- The rapid growth of IDNs may be creating inconsistencies among legacy contracts between the various entities and we may be seeing the results of two different contacts that have not yet been harmonized after acquisition.
- Negotiations with the main/urban campus may account for the main campus having a 340B designation and thus payers extract some of the difference in acquisition cost.
Differences between home care and outpatient site of care reimbursement rates
- Payers may be distinguishing their reimbursement schemas based on site-of-care type to favor home care utilization over outpatient.
- Payer policy may not reimburse for administration services in home care that they reimburse in outpatient settings, so product reimbursement is set higher in home care to accommodate these policy differences.
Primary research and utilization analyses can contribute to a greater understanding of the drivers of differences, but the value of understanding that these differences exist provides information-based leverage for the manufacturer. Understanding how this varies for competitors likewise may offer manufacturers a marketing advantage, to target sites of care with greater provider incentives relative to competitors.
Insight 2: Payer Use of Reimbursement to Influence Originator/Biosimilar Selection
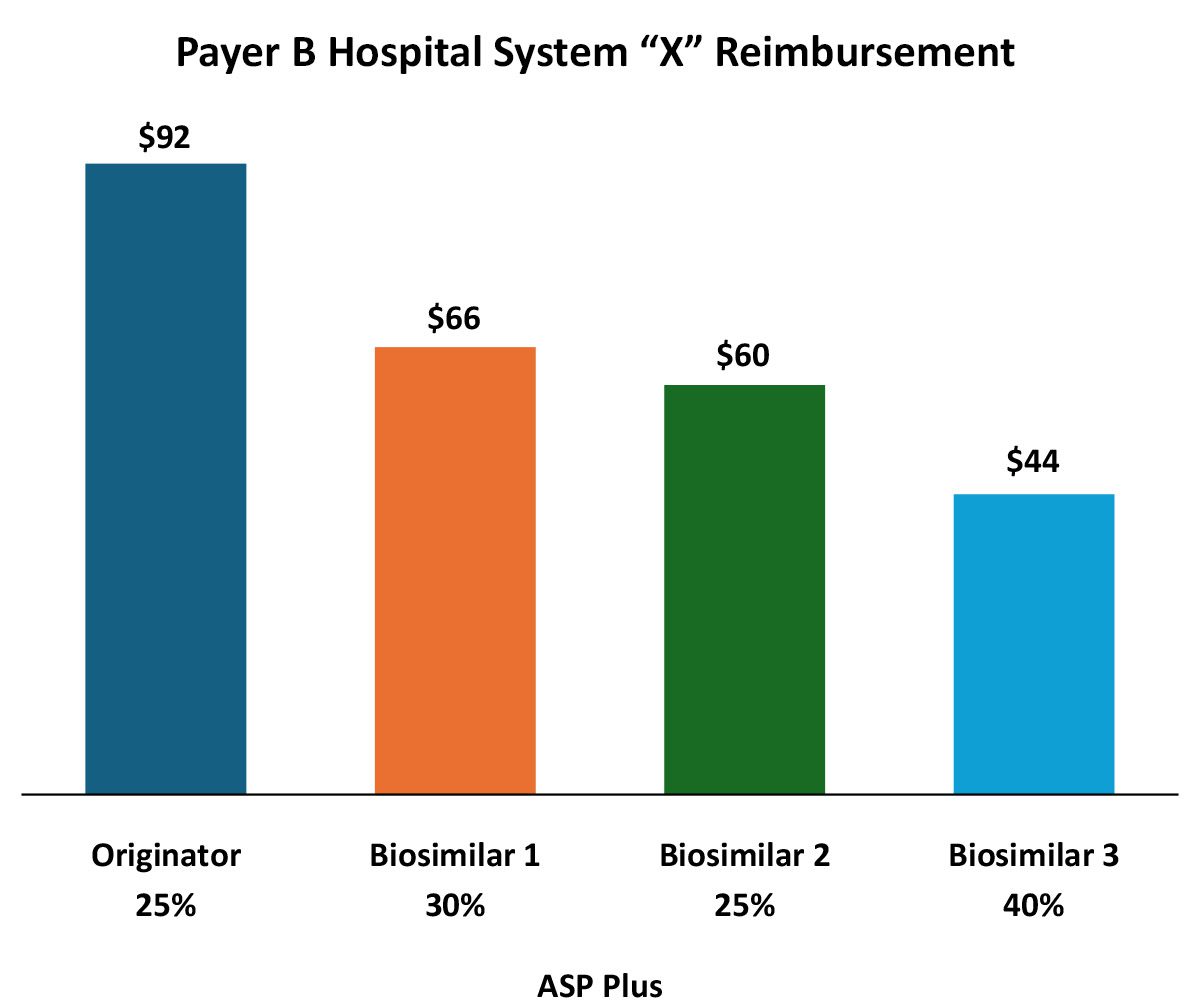
In addition to formulary/medical policy influences, payers can and do vary reimbursement to reinforce biosimilar preference. In this example, reimbursement for the various biosimilars varies rather dramatically. From the provider perspective it appears that the payer is favoring the originator, but that may not tell the entire story.

Implications For Manufacturers
The wide variation in both the reimbursement amount, but more importantly, in the differing ASP markups reflect the increasing complexity for manufacturers in pricing and contracting in a market with existing or impending biosimilar competition.
This can serve the originator in a biosimilar defense strategy, or a biosimilar manufacturer considering entrance and/or improving one’s net revenue and/or market share.
While the originator is reimbursed at the highest rate per unit, the markup over ASP (and likely, net cost recovery) is much higher for Biosimilar 3. Providers substituting Biosimilar 3 for the originator may see greater net revenue for the infusion than if they use the originator. Of course, ASP may not reflect all of the discounts for a specific provider (rebates, off invoice, 340B, etc.). From the payer perspective Biosimilar 3 may represent the most cost-effective option even if it is being marked up more than the others (again depending on payer-specific rebates).
Trinity’s Take: The Value of Reimbursement Information in Biosimilar Pricing and Contracting Strategy
Accurate and complete reimbursement data can play a significant role in manufacturer pricing and contracting strategy for both payer and provider contracts.
- Leverage Reimbursement Data in Crafting Competitive Payer Rebates.
Reimbursement is a signal as to the payer’s Class of Trade and/or site of care strategy. It also provides insight into potential competitive contracting when access decisions do not align with payer costs. Understanding the basis of and markups for payer reimbursement may reduce the manufacturer’s need to meet or exceed a specific rebate level. - Leverage Reimbursement Data in Provider Contracting Strategy.
Understanding provider reimbursement will help in tailoring provider discount offers that are profitable but not leaving money on the table. Local market influence analysis would augment the strategy with insights into whether providers or payers wield power in their local markets for the therapeutic area. - Monitor Changes in Reimbursement to Anticipate Payer and Provider Contracting “Asks.”
If reimbursement rates drop, providers may come calling for additional discounts to continue to dispense.
How Trinity Can Help
Trinity’s Access Analytics and Pricing and Contracting teams are already using this newer data to inform access marketing, pricing and contracting strategy. Reach out to Greg Berzolla at gberzolla@trinitypartners.com for more information.